The sales growth rate was particularly strong. Analysts had expected 3.7% in 2Q. The consensus forecast for 3Q and for the full-year are still for 3.7%; so, some moderation is expected.
The recent macro data supports growth of 3.5% to 4.5% in sales. But it shows a curious lack of accelerating growth after the winter slump.
Real personal consumption (PCE), which comprises about 70% of GDP, grew at annual rate of just 2% in July. There had been a post-winter pop to 2.5% in March, but the rate of growth has declined every month since then.

These figures are inflation-adjusted. Adding a 1.6-2% deflator yields a roughly 4% annual growth rate in nominal terms, equivalent to the sales growth rate expected for SPX in 2014.
PCE is not an outlier. Real 'final sales' (which is GDP less changes in inventory, i.e., what was consumed during the quarter) grew at 2.2% last month. Real retail sales grew at 1.6%. All of these measures of demand are consistent and all also show a positive but tepid rebound after the post-winter pop.
In the bigger picture, demand growth is far below what the US economy is accustomed to. Real final sales has been growing at just 2-2.3% for the past 2-1/2 years. In prior expansionary periods, 3-5% annual growth was typical.
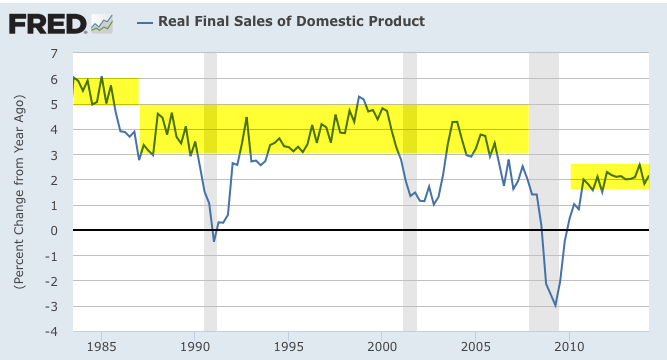
The prior two bull markets benefitted greatly from a boom in housing. This spurs demand and thus employment. There's also a wealth effect with a reinforcing impact on consumption. Recovery in housing has so far been tentative. Until this changes, overall demand growth in the range of 3.5-4.5% (nominal) seems likely to persist.

All of which is to say that faster SPX sales growth, at this point, does not appear imminent. The consensus for growth of about 3.5-4% is about right.
What has driven the higher rate of growth in earnings has been corporate margins. These are now 50bp higher than they were just a year ago. Margins have never been higher. For non-financials, this has been driven by low interest and labor expenses.

In other words, without the expansion in margins, EPS would also be growing 3.5-4% instead of 7.7%.
One bit of good news is that margins have declined at least a year or so before every recession since the 1950s. On this measure, at least, the risk of a contraction appears to be low.
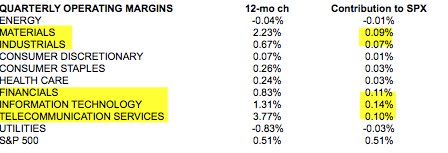
Another positive is that the expansion in margins has been wide spread throughout most of the individual sectors. Financials, technology and telecom sectors account for about 70% of the gain in margins over the past year, but industrials and materials also saw meaningful margin expansion. In other words, there is no apparent anomalous rise in margins that would suggest an aberration ready to be reversed.
The consensus expects SPX margins to continue to expand in the quarters ahead. That's not a surprise as consensus forecasts are driven by recency. A year ago, we would have said a further rise in margins was unlikely, yet here we are.
Roughly 40% of SPX sales are from outside the US. Much of this is from Europe. Optimistically, an improvement in Europe is a source of improvement as margins there have been a drag. Of course, Europe can also deteriorate further, too.

Perhaps a bigger concern is that, outside of SPX, overall non-financial corporate margins in the US are already declining. Smaller companies are doing much less well than the large companies that comprise the SPX. It's not clear if this is a consistent leading indicator for SPX.

The bottom-line is this: 2Q corporate results were exceptionally strong. It was not heavily influenced by share buybacks. Sustaining earnings growth when sales growth is just 4% requires historically high margins to become even more so. Aside from this being unprecedented, there is no clear deterioration already underway that suggests a decline in margins is imminent.
The Week Ahead
Our expectation was that indices would encounter a pause this week before heading higher. Instead, SPY gapped up $1 on Monday. There was no material gain in the remainder of the week, but also no give back. The Monday gap accounted for the majority of the week's gains.
Last week, we reviewed several strong studies to suggest further gains are ahead (post). However, we still expect some weakness first.
SPY has now closed above its 5-dma 16 days in a row. In the past 3 years (or longer), the only slightly longer streak was from the June 2013 low (19 days). As we have said many times before, streaks like these do not normally mark an uptrend high. This implies that the 201 area in SPY should be retested after weakness.
As a reminder, here is the chart we showed last week. Highlighted are prior long streaks above the 5-dma. A week or two of choppiness follows the first close below the 5-dma, then a higher high.

This week, SPY had two consecutive down closes from a high. In the past, there has been a lower close (i.e., below 200.1) in the next 5 days more than 70% of the time. The average drop is 0.7%. The few exceptions in the table below (first column) occurred when SPX was already at a low or on its 13-ema. That's not the case here. But, you can also see that an even higher proportion closed higher after the first close lower (second column).

On the SPY daily, a negative divergence in RSI is taking shape. It's very similar to the one in June 2013. Momentum is slowing. Given the rapid advance, that is not surprising. Importantly, the 13-ema (green line) has held the low after every prior advance similar to this one (arrows). That level corresponds to 199, which was prior resistance. A retest of this level next week seems likely.

The weakest US index has been RUT. This week, due entirely to the Monday gap up, it has regained the key 1160 level. So long as this holds, RUT may well retest the high end of its recent range. There is no divergence in its RSI and MACD is still rising.

The CRB index has a potential buy set up. It's not perfect (the 50-dma has a steep downslope), but every similar set up has risen higher at least 1-2 weeks. The 50-dma has been a clear resistance level in the past. Still, that's better than a 2:1 reward/risk versus the recent low.

Making this of especially high interest is that sentiment is at a substantial low. This has been where rallies in commodities have started. We think this is worth watching (the next three charts and statistics are from Sentimentrader).

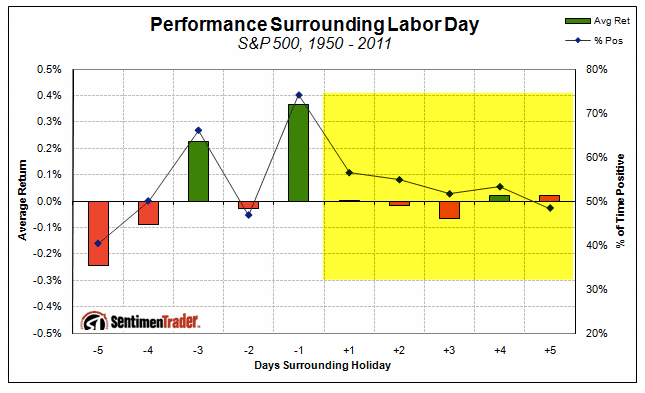
The big watch out is September weakness. It has been the worst performing month over every time frame (chart). That is especially true when August has been strong: when August has been up 1% and at a high, September has been down 85% of the time for an average loss of 1.6%. When August has been up more than 3%, like it was this year, September has an average loss of 2.6%.
To wit, seasonality is not a tailwind next week.
Our weekly summary table follows:

If you find this post to be valuable, consider visiting a few of our sponsors who have offers that might be relevant to you.