* * *
After rising the past two weeks, during which oil prices rose 20% from their lows, equities fell hard this week. SPY lost 3%, RUT lost 5% and NDX lost 6%. The big winner was gold, which gained 5%.
Given the close correlation recently between equities and oil, it's no surprise that oil led to the downside, losing 8%. This continues to be the biggest wild card driving the direction of equities.
Perhaps more surprising is that the dollar index fell nearly 3%. Should this continue, this would be a net positive for equities as the repatriated profits of overseas sales benefit from a higher trading partner currency. Naturally, the dollar cost of US products also becomes more affordable with a lower dollar. There is, therefore, a close link between the dollar and revenues for SPX companies: as the dollar falls, revenue growth increases. More on this in a recent post here (chart from Yardeni).

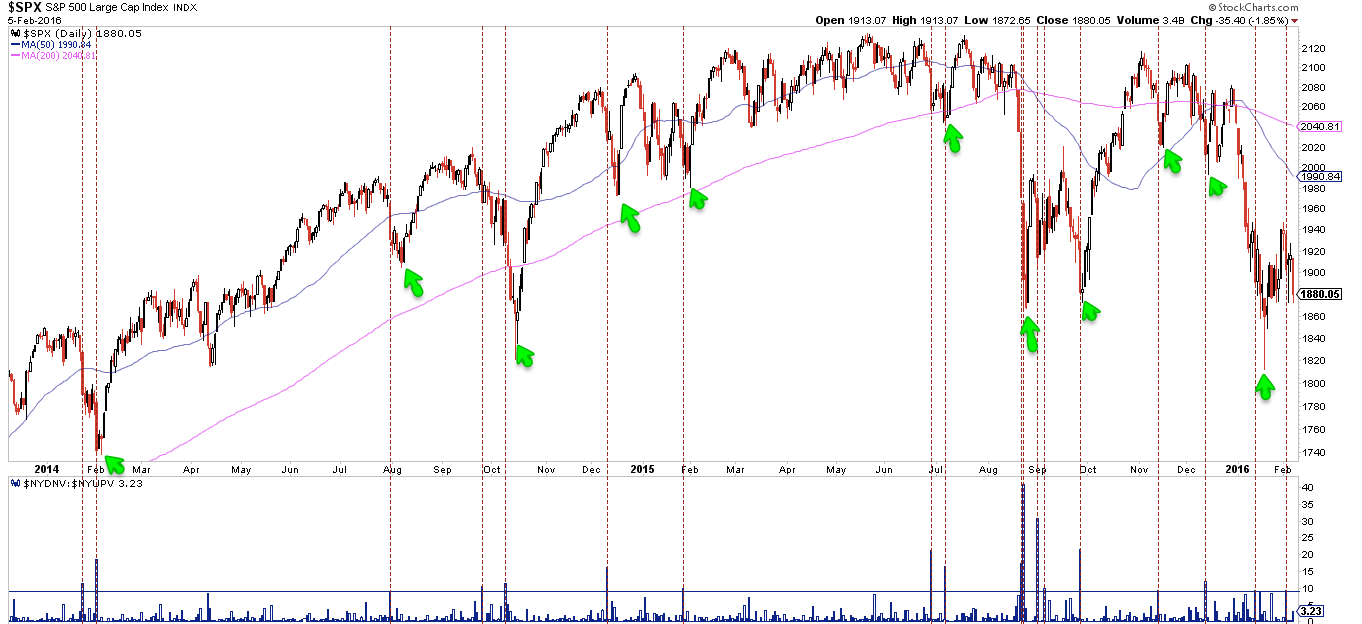
The longer term technical picture for SPY is bearish (reviewed last week here). There was an opportunity for that to start to change this past week. Bullish markets become overbought, bearish markets do not. SPY ended near overbought last week (arrow, top panel) but instead of becoming fully overbought, it just rolled over. That is bearish price action.
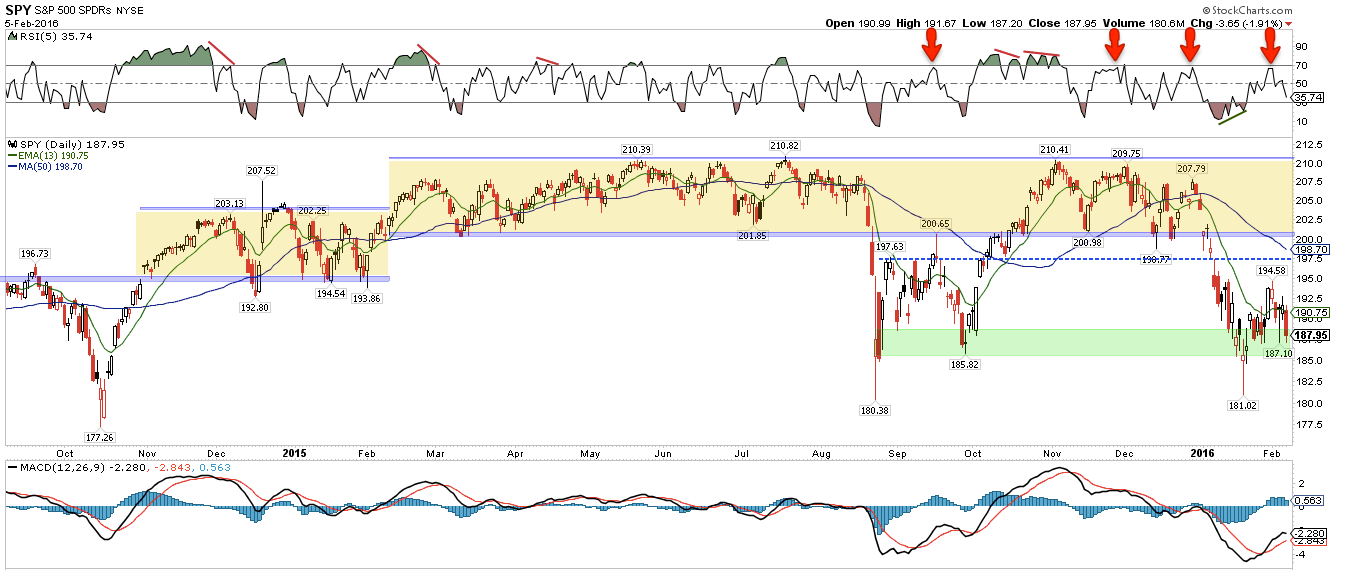
SPY is not only below its longer moving averages (50-d and 200-d) but now even under short term averages (13-ema and 5-d). In the chart above, it's retesting the lows from August, September and January; the more times an area is tested, the more likely it is to break. The October 2014 lows under $180 could be next.
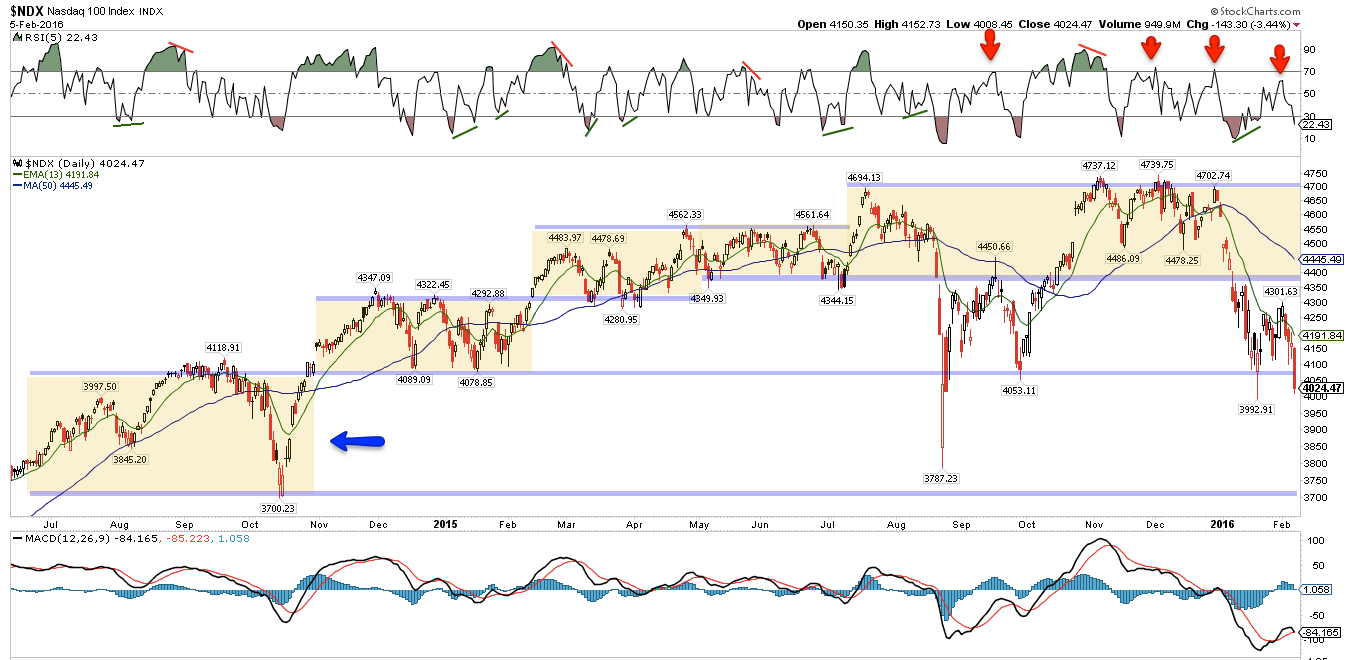
A week ago, it was possible to point to NDX as remaining in a longer term bullish configuration: it made a new ATH in December and the January low was well above the August/September low. That's no longer the case. This week, NDX led to the downside. On a closing basis, the January low has been undercut. Moreover, the recent bounce was much weaker than SPY's (arrows, top panel). It's now back in a trading range from late 2014 that extends down to the 3700 area, 7% lower (blue arrow).
The two week bounce in SPY fell short of a 50% retracement. Our guess was that a 62% retracement, to 199-200, would be possible. This also shows how weak the markets are.
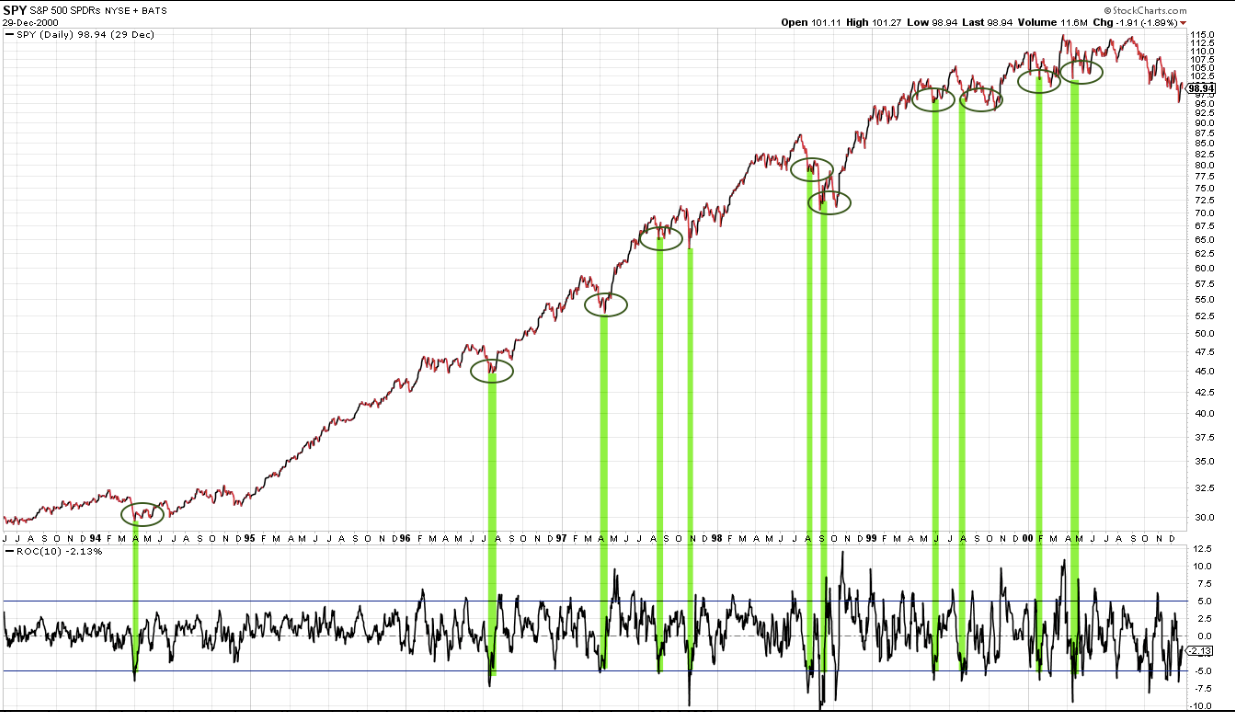
On the other hand, that SPY is now retesting its lows from January is not surprising. We showed this pattern after the January low (here). A high proportion of 5-10% corrections retest their lows in the weeks ahead (circles). That has turned out to be the case now as well. Why? Because downward momentum takes time to dissipate.
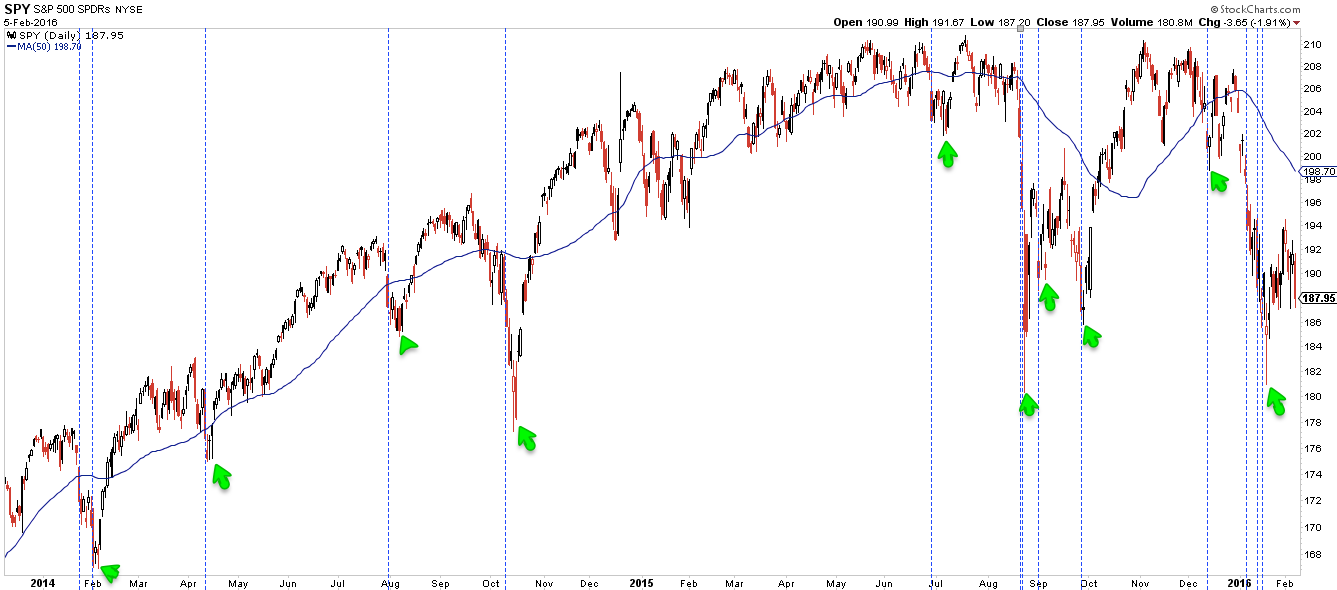
Similarly, momentum on Friday was strongly negative, with SPY losing close to 2% and NDX losing almost 3.5%. Since the start of 2014, SPY has lost a similar amount 15 times (vertical lines) and essentially every instance saw the index undercut the low in the days ahead.
Friday's sell off was not accompanied by extremes in breadth: advance/decline volume was 3:1 negative and Trin was even at 1.0. That compares with Tuesday's sell off, where A/D was more than 9:1 negative and Trin spiked to 2.3. Is the price low on Friday without breadth extremes unusual? Probably not.
The common pattern is for breadth extremes to precede price lows. A post describing this set up in Trin can be found here. The chart below looks at A/D extremes (vertical lines): in most instances, a lower low in price follows (arrows).
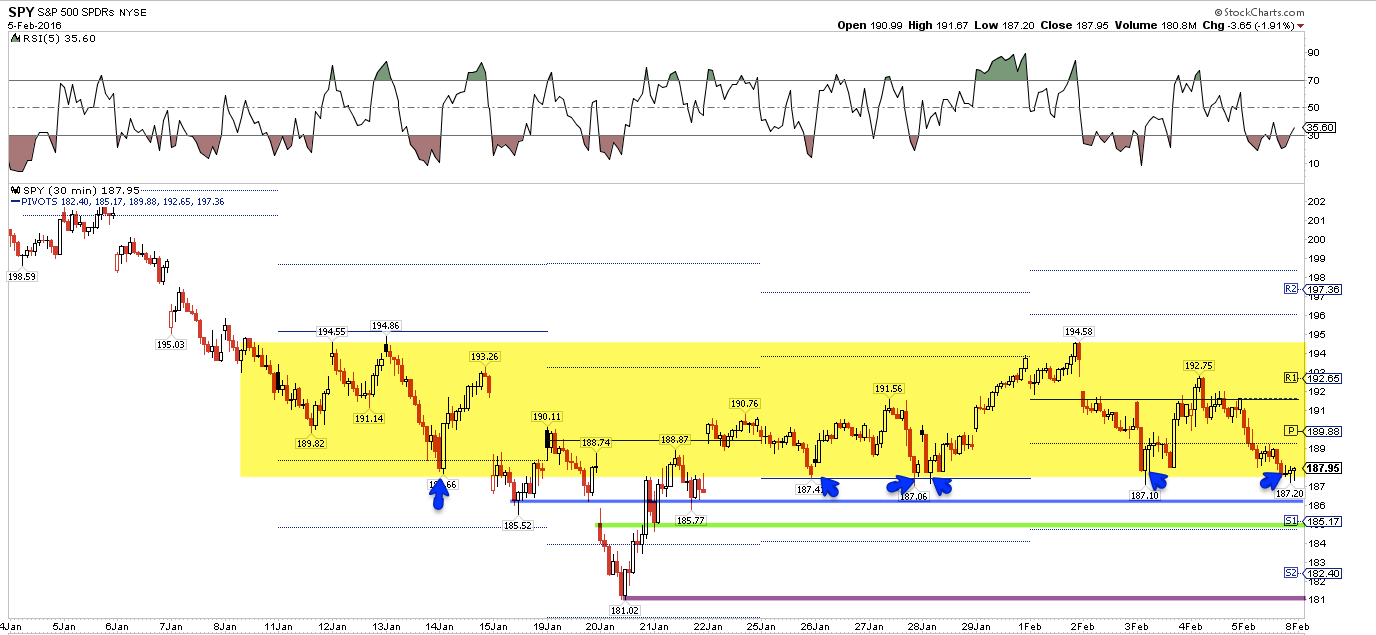
Friday's low and close near 187.5 was at the bottom of a multi-week range (in yellow). This bottom has been tested 5 times in the past two weeks. It would be a near miracle if it wasn't broken after this many tests, and the studies above suggest follow through momentum lower. The next levels to watch are 186.5 (blue line), 185 (green line; also WS1 next week; also the lower Bollinger) and 181 (purple line).
All of this sounds very bearish and, to be clear, falling prices with "lower highs" and "lower lows" is the definition of a downtrend.
The watch out is that these facts are well known. A large majority of investors are bearish and those extremes in sentiment most often reverse. That doesn't mean that new highs are imminent, but equities don't typically drill ever lower when that outcome is widely expected.
NAAIM (active investment managers) are now the equivalent of 22% long equities. This level has rarely been lower over the past decade. When these investors have been this bearish in the past, equities have risen in the weeks ahead (green shading). It may not have been the exact low, but it has been close. The only exception was in the late-2008 meltdown, a situation very unlike today (orange).

Even if US is entering a bear market, excessive pessimism is likely to be worked off before price declines further. In the chart above, note the green shading in early and mid 2008.
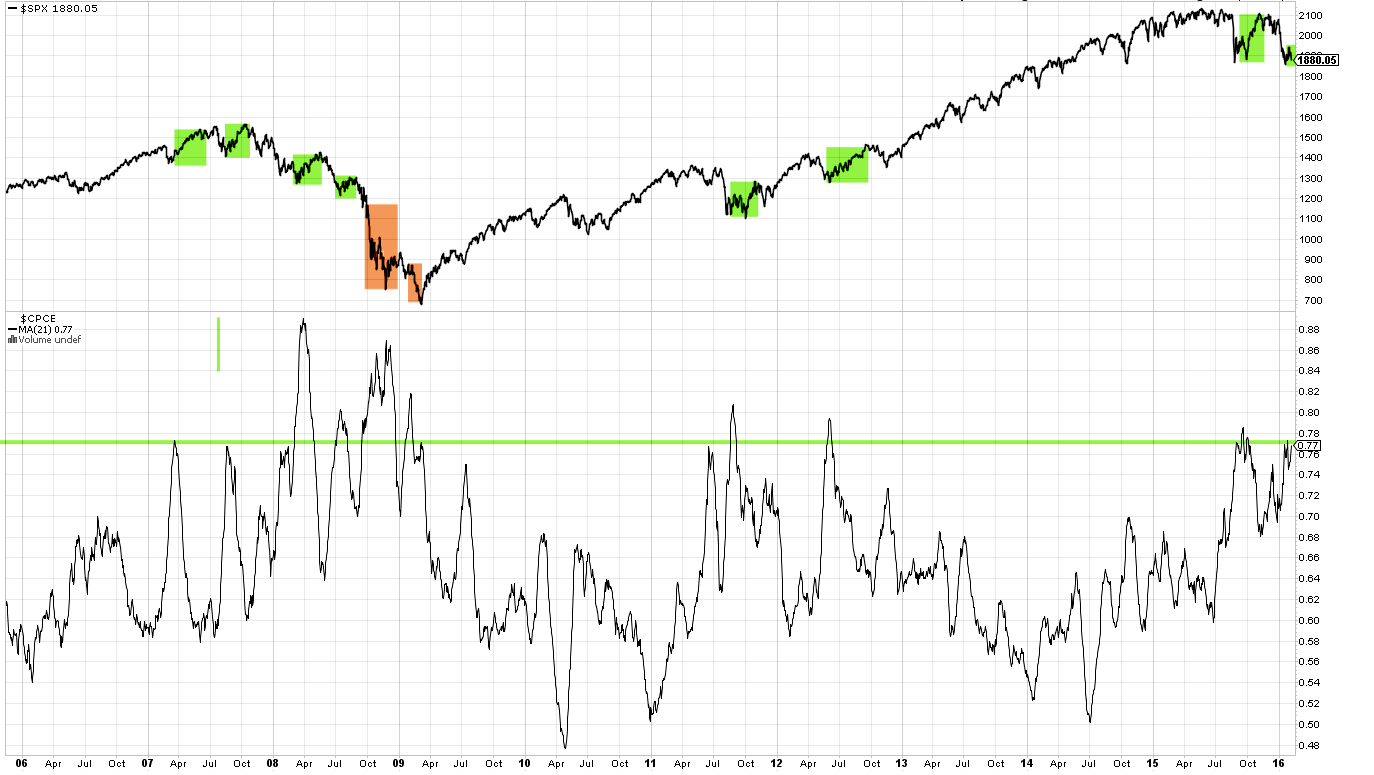
Similarly, equity-only put/call ratios show excessive downside protection is being sought. Again, only in the depths of the 2008 meltdown did equities fall further without any interim reprieve. The rallies in March/May 2008 and July/August 2008 were 10% and 7%, respectively. Those rallies failed, but they were significant enough to reset investor expectations. We seem to be close to a similar situation now.
The sell off seems to be mostly driven by fear itself. Earnings data has been predictably bad (here). The macro data continues to show only a minor risk of an imminent recession (recent posts on this here and here). The Nowcast expects GDP growth of 2.2% this quarter; this is far from recessionary.

The employment and wage data continues to be solid. In January, both manufacturing (+29,000) and retail trade (+58,000) saw their strongest employment growth in the past twelve months. Given the consternation over manufacturing, this is fairly remarkable.

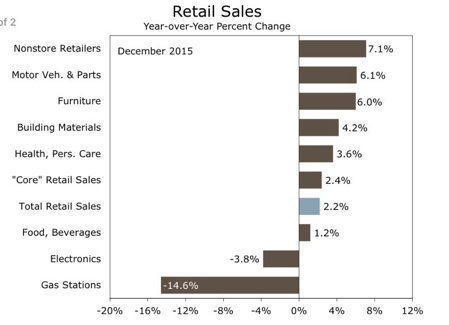
Retail sales in December were solid across a wide variety of categories. The headline figures show slowing growth almost exclusively due to the lower price of gas sold at filling stations. In a recession, growth is slow across a majority of categories. That is clearly not the case now.
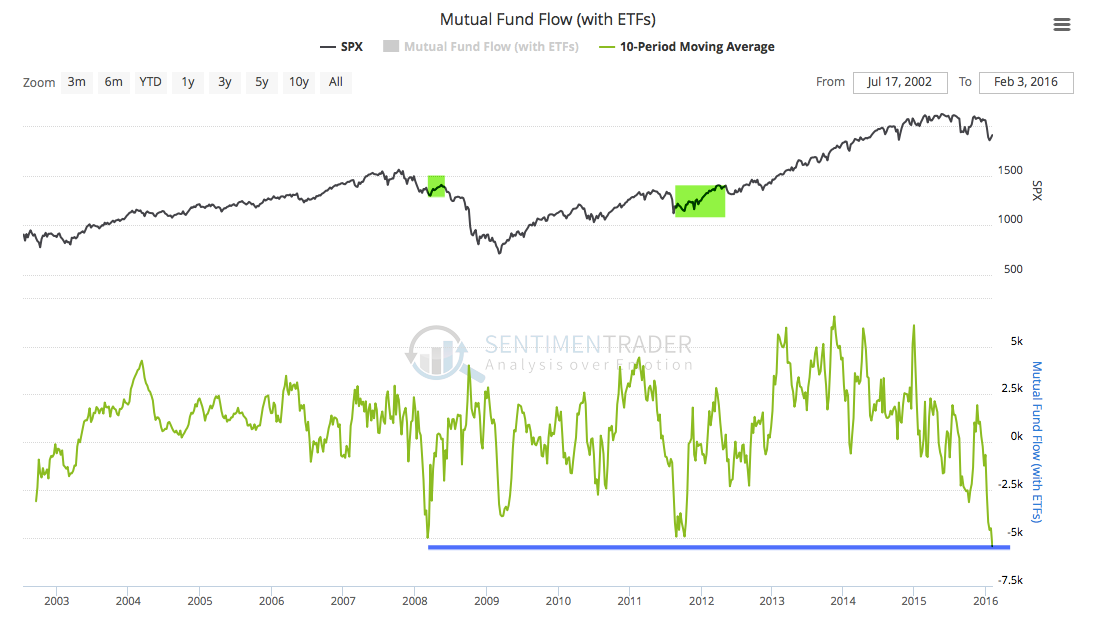
The sell off seems now to be feeding on itself in a self-reinforcing cycle, with fund outflows causing sell offs that lead to further fund outflows. Investors pulled another $6.5b out of equities funds this week. Those fund flows have been negative 9 of the past 10 weeks. In more than 10 years, fund flows have never been this extreme, even in 2008. The only comparable periods were March 2008, from which SPY rose 10% in two months, and August 2011, from which a new leg in the bull market began. Further selling from here would be unprecedented (data from Lipper and Sentimentrader).
Meanwhile, inflows into the safety of treasuries has been positive 8 weeks in a row. As we showed last week, those treasury inflows are also historic. Treasury yields are now on levels from which they have previously reversed higher.

In summary, equities continue to trend lower. NDX undercut its January low this week, and Friday's sell off was extreme enough that it is unlikely to mark the low. Negative investor sentiment seems to be feeding on itself, with sell offs leading to historic fund outflows and further sell offs. These extremes have reached a point where they most often reverse. Even if US equities are in a bear market, a rally of 7-10% is likely close at hand.
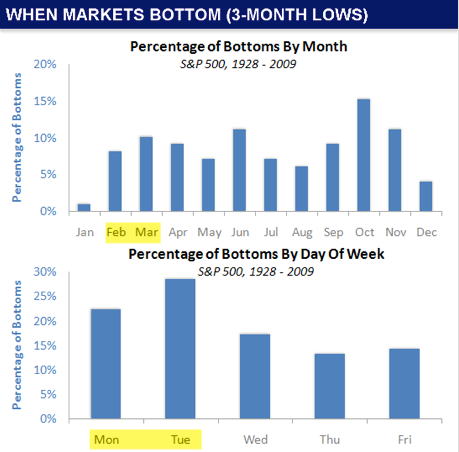
Importantly, there has been no price action that yet suggests a reversal in trend. Either a spike down lower that reverses higher or a multi-day basing pattern is needed before a price low can be identified with any confidence. In other words, we are looking for a clear low in price to trade against, a sign that larger investors are interested in putting capital into the market. It could come as early as Monday, as most price lows occur early in the week. Turnaround Tuesday could be on deck (data from Sentimentrader).
If you find this post to be valuable, consider visiting a few of our sponsors who have offers that might be relevant to you.